Vikings Home & Road Records: Four Stadiums, One Cold-Weather Truth
Updated: August 7, 2026

Since 1966, the Minnesota Vikings are 303-158-3 at home (.656) and 213-244-5 on the road (.466). The home mark ranks 5th in our home records rankings — one spot ahead of Green Bay — and comes with a distinction only one other team can match: seven perfect home seasons, tied with New England for the most by any franchise in the last sixty years. Four of them happened outdoors at Metropolitan Stadium. Three happened in the Metrodome. That split is the story here. The Vikings have played home football in four different buildings — outdoors, indoors, outdoors again, indoors again — and the roof never mattered much. If anything, they were better without one.
Vikings Home and Road Records by Decade
| Decade | Home | Pct | Road | Pct | Gap |
|---|---|---|---|---|---|
| 1960s (from '66) | 14-12-2 | .536 | 13-13-2 | .500 | .036 |
| 1970s | 54-17-1 | .757 | 45-26-1 | .632 | .125 |
| 1980s | 48-29 | .623 | 29-46 | .387 | .236 |
| 1990s | 53-27 | .663 | 42-38 | .525 | .138 |
| 2000s | 55-25 | .688 | 29-51 | .363 | .325 |
| 2010s | 50-28 | .641 | 29-48-2 | .380 | .261 |
| 2020s (through '25) | 29-20 | .592 | 26-22 | .542 | .050 |
The 1970s row is the monument: .757 at home and .632 on the road. At the Purple People Eater peak, 1969 through 1977, the Vikings went 51-11-1 at home (.817) with five unbeaten home seasons in nine years — and 45-18 (.714) on the road, one of the great sustained traveling stretches of the era. The 2000s row is the opposite extreme: a .325 split, the widest in franchise history, and on raw percentages a dead heat at exactly .3250 with the 1990s Broncos and Falcons for the widest decade divide by any franchise in the sample — a tie we first mapped in our Broncos deep dive. The 2020s look like the modern pattern this series keeps running into: the O'Connell-era gap is just .023 — a good team that wins everywhere.
Metropolitan Stadium, the Metrodome, TCF Bank, and U.S. Bank: Vikings Home Records by Stadium
| Stadium | Roof | Seasons | Home | Pct | Road (same window) | Pct |
|---|---|---|---|---|---|---|
| Metropolitan Stadium | Outdoors | 1966–81 | 78-35-3 | .685 | 64-49-3 | .565 |
| Metrodome | Dome | 1982–2013 | 162-88 | .648 | 101-149-1 | .404 |
| TCF Bank Stadium | Outdoors | Dec 2010 + 2014–15 | 11-6 | .647 | 7-9 | .438 |
| U.S. Bank Stadium | Fixed roof | 2016–25 | 52-29 | .642 | 41-37-1 | .525 |
Four buildings, and the ranking runs backwards from every intuition about Minnesota winters: the outdoor Met is the best of the four, and all four sit within .043 of one another — the Vikings' home advantage travels across buildings almost untouched, which no other franchise in this series can say. But the slope, gentle as it is, runs downhill from the building without a roof. Bud Grant's teams, famous for refusing sideline heaters, hold the best home percentage in franchise history in the coldest venue.
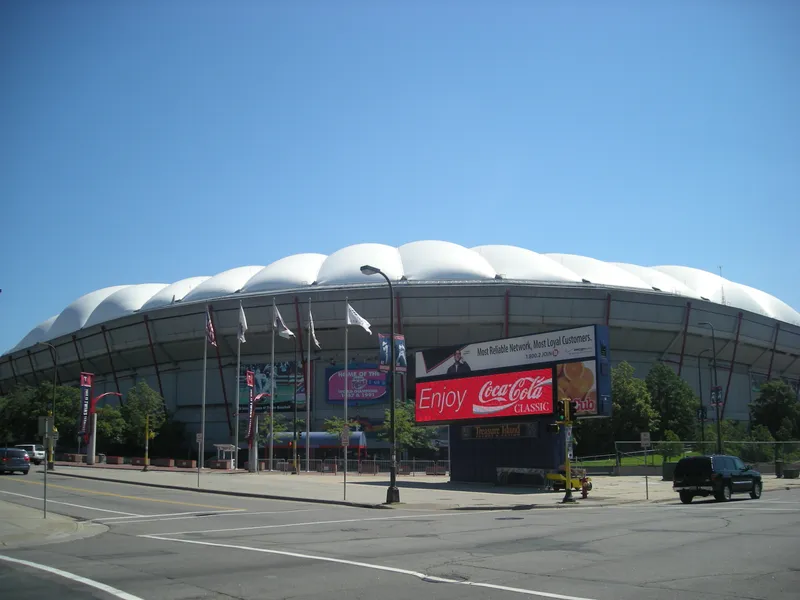
The strangest month in the four-building history is December 2010, when the Metrodome roof collapsed under a snowstorm and the Vikings played home games in three different stadiums in sixteen days: the Metrodome on December 5, Ford Field in Detroit on December 13 (a "home" game we exclude from the sample as a neutral site — the same game noted in our Lions deep dive), and outdoor TCF Bank Stadium on December 20.
Vikings December Records: Outdoors vs. Indoors
The Grant-era mystique survives the data the same way Green Bay's did — by getting stronger under inspection. In December and January, the Vikings are .644 at home all-time. Split it by roof:

| Venue | Dec–Jan home | Pct |
|---|---|---|
| Metropolitan Stadium (outdoors) | 12-5 | .706 |
| Metrodome | 42-26 | .618 |
| TCF Bank Stadium (outdoors) | 4-2 | .667 |
| U.S. Bank Stadium | 18-9 | .667 |
Combined, the Vikings are 16-7 (.696) in December and January outdoors, and 60-35 (.632) indoors. Moving indoors made their winters worse. It's the same December pattern this series keeps finding: Green Bay wins outdoors (.743), Detroit loses indoors (.487), and Minnesota — the only franchise that tried both — was better in the snow.
Vikings Home and Road Records vs. the Packers, Bears, and Lions
| Rival | Home | Pct | Road | Pct |
|---|---|---|---|---|
| Packers | 33-26 | .559 | 26-31-3 | .458 |
| Bears | 39-21 | .650 | 27-31-1 | .466 |
| Lions | 44-14-1 | .754 | 36-24 | .600 |
Green Bay: 33-26 hosting, 26-31-3 in Wisconsin — and the two franchises keep tying: Minnesota's last two ties, 26-26 in 2013 and 29-29 in 2018, both came at Lambeau. The bigger rivalry number sits at the top of this article: over sixty years, Minnesota's home record ranks one place ahead of Green Bay's.
Chicago: 39-21 (.650) at home against 27-31-1 on the road — the standard shape.
Detroit: total control — 44-14-1 (.754) hosting, the best home mark against any rival in this series, and 36-24 in Detroit. The Vikings are the only NFC North team with winning records against the Lions at both venues, the exact mirror of the both-venue losing sweep in our Lions deep dive.
Biggest Vikings Wins, Worst Losses, Streaks, and Perfect Seasons
| Category | Score | Opponent | Date |
|---|---|---|---|
| Largest home win | 51-3 | Cleveland | Nov 9, 1969 |
| Largest road win | 43-3 | at Dallas | Nov 13, 1988 |
| Worst home loss | 3-40 | Dallas | Nov 20, 2022 |
| Worst road loss | 7-51 | at San Francisco | Dec 8, 1984 |
| Largest home shutout | 38-0 | Atlanta | Nov 9, 1975 |
The worst losses bracket the sample: the 1984 road collapse, and — the recency surprise — 3-40 to Dallas at U.S. Bank in 2022, the worst home loss in franchise history. The most recent shutout is fresher still: 31-0 over Washington in December 2025. The longest home winning streak is 14, spanning the perfect home seasons of 1969 and 1970; the darkest road stretch is a 16-game winless run from December 2000 to December 2002, wrapped around the 0-8 road year of 2001. The 2013 road season deserves its own sentence: 0-7-1, meaning the Vikings' best road result that year was a tie. And the perfect-home ledger — 1969, 1970, 1973, 1975, 1989, 1998, 2009 — is matched by nobody but New England, while the Vikings have never once gone winless at home.
What the Home/Road Split Means for a Vikings Mock Schedule
Minnesota is the easiest schedule case in this series. The home field has held near .650 through four buildings and sixty years, the road record rises and falls with the quality of the team, and December at home has been a strength with a roof or without one. The one modern complication is the international slate — the Vikings have given up two designated home games to London since 2013, more than most contenders do, and December 2010 showed what losing a building for even a month does to a season. If you're building a Vikings schedule in the MockSlate builder, keep it simple: lean the home schedule toward December. That's where the Vikings have won for sixty years, in every building they've tried.
Data: all Vikings regular-season games, 1966–2025 — 464 home, 462 road; seven neutral/international games excluded (Ford Field 2010; London 2013, 2017, 2022, 2024, 2025; Dublin 2025); the December 20, 2010 game at TCF Bank Stadium was a true home game and is included. Records list ties separately, and win percentages count a tie as half a win, the NFL's standard method. Companion pieces: Every NFL Team's Home Record Since 1966, Every NFL Team's Road Record Since 1966, and the full Team Deep Dives series.
MockSlate is an independent fan tool and is not affiliated with, sponsored by, or endorsed by the National Football League or any NFL team. Team names are used for identification purposes only.
The Vikings’ record in cold and hot weather since 1999
FAQ
What is the Vikings' all-time home record?
Since 1966 the Vikings are 303-158-3 (.656) at home — 5th-best in the NFL over that span, one spot ahead of Green Bay — across four home stadiums: Metropolitan Stadium, the Metrodome, TCF Bank Stadium, and U.S. Bank Stadium.
Which Vikings stadium had the best home record?
Outdoor Metropolitan Stadium, at 78-35-3 (.685) from 1966 to 1981 — ahead of the Metrodome (.648), TCF Bank Stadium (.647), and U.S. Bank Stadium (.642). All four sit within .043 of one another.
How many perfect home seasons do the Vikings have?
Seven — 1969, 1970, 1973, and 1975 outdoors at the Met, and 1989, 1998, and 2009 in the Metrodome — tied with New England for the most by any NFL franchise since 1966.
Are the Vikings better in December indoors or outdoors?
Outdoors. Since 1966 they are 16-7 (.696) in December and January home games played outdoors (the Met and TCF Bank Stadium, including the roofless December 2010 game) versus 60-35 (.632) indoors (the Metrodome and U.S. Bank).
Related team pages
Build your own mock schedule
Now put it into practice — place every game into a broadcast-accurate window and see the whole season take shape.
Open the Mock Schedule Builder →